Design and Implementation of a ProtocolAgnostic Serial Bus Analyzerfor Real Time Waveform Debugging and Verification
Design and Implementation of a Protocol
Agnostic Serial Bus Analyzer
for Real Time Waveform Debugging and Verification

Abstract- Serial bus analyzer presented here is generic serial bus debugger which can basically monitor single input line for any serial bus protocol and displays the frames/state and values both big and little endian in a hex format on the waveform like gtkwaves, VCS etc. The design is protocol agnostic, synthesizable and configurable for multiple instances.
I. INTRODUCTION
Debugging serial bus protocols can be a daunting task, especially when dealing with complex communication systems. A single error can cause a domino effect, resulting in cascading failures that are difficult to diagnose and fix. In such cases, a generic debugger can be a lifesaver.
A generic debugger is a tool that allows you to monitor and analyze the data traffic on a serial bus. It can help you pinpoint errorsand track down their root causes quickly and efficiently. Additionally, a generic debugger can help you validate that your code orhardware design is functioning correctly.When debugging serial bus protocols, it is essential to capture the data traffic on the bus in real-time. This is where a tool like alogic analyzer or an oscilloscope comes in handy. These tools can capture the data traffic on the bus and display it in a waveformor a table format. However, they only provide raw data, and interpreting this data can be a time-consuming task.A generic debugger solves this problem by analyzing the captured data traffic and presenting it in a more user-friendly format. Itcan decode the data traffic and display it in a human-readable format, allowing you to quickly identify errors and anomalies.Additionally, a generic debugger can provide real-time notifications of errors, making it easier to identify and troubleshoot issues.
II. PROBLEM STATEMENT
We have lots of serial bus protocols in our Chips, we take lots of 3rd party serial bus protocols like CAN, SPI, I2C, eMMC, JTAG etc.We need to run the simulation for verification purpose and need to make sure protocol is working correctly. Each serial protocol uses different frame format as per there need and requirements.Also, while debugging we need to note down each bit looking at the waveform and cross check it with protocol to understand if its correct or incorrect.There is lot of chance of human error getting injected while collecting the bits on each edge of clock and cross checking it against the specification. We may not always have the verified monitor which can be used for checking.This happens at the very initial phase of Verification IP development.
III. SOLUTIONS
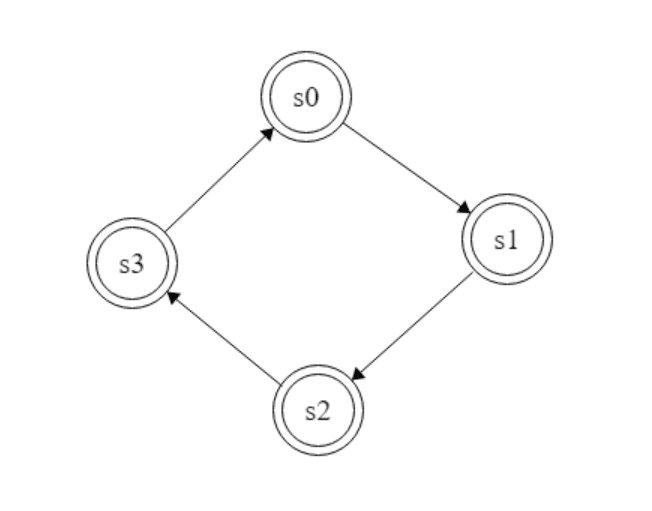
The solution that I have developed is a generic serial bus protocol analyzer which can be used across any serial bus protocol and can have parameterized frame format and can have multiple instances of the debugger.It will basically give a visual display of frames in hex format on the waveform which would be lot easier to debug. This way we don’t have to deal with each bit on serial bus and can save the debug time resulting in the many man hours of saving.One of the significant advantages of a generic debugger is that it can be used to debug a wide range of serial bus protocols. It is not tied to a specific protocol or vendor and can be adapted to different protocols and configurations. This makes it a versatile tool that can be used in various debugging scenarios.The secret sauce of generic serial debugger is the Generic FSM state machine that’s been implemented which agnostic and can have configurable number of states. The only condition is it will only move from states to states in a sequential manner.In most of the cases the FSM is implemented in case statement which makes it non-expandable. In my case what I have done is implemented the FSM by taking dynamic memory bit [7:0]state_table[].
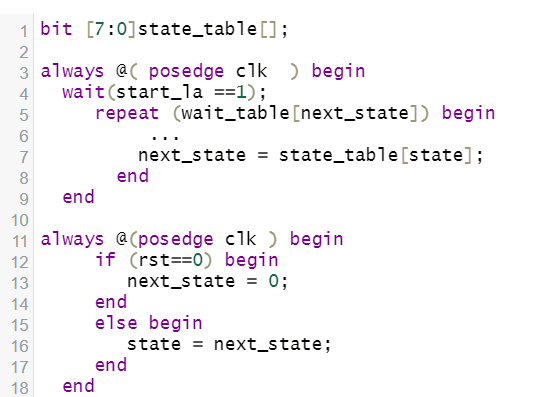
If you observe, the state is getting updated as next_state and content of state is used to get the output of next_state.Consider the memory is declared as [next_state-1:0]mem[state-1] which is dynamic in nature.I also maintain one more memory to store the wait cycle for each field in serial bus protocol and call it as wait_table[no_state-1:0] which basically helps in knowing how many clk cycles to wait in each state.
IV. IMPLEMENTATION DETAIL
The following are steps to configure the generic bus protocol in your testbench.• Instantiate the serial bus debugger interface inside your testbench top.• Declare the set the parameter no_of_state as how many no of states are there your serial bus protocol• Declare the wait_table in the following format which basically signifies the number of bit in each states• Assign the signal start = 1 from the time period you want the debugger to analyses the input signals
V. SAMPLE EXAMPLE CODE
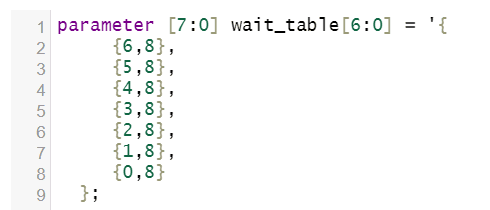
Lets take a case where there are 2 serial bus protocols called “ME” and “MY”. In ME protocol there are just 2 data frames 1st oneis 1 bit and 2nd of 64 bits and in “ME” protocol it has 7 data frames, and each data frame contains 8 bit of data.a) Declare the wait_table as mentioned in figure 1 and figure 2 here the left-hand side number denotes the frame / state and right-hand side denote the number of bits in the frame / number of wait state inside the state. For e.g., In an imaginary “My” serial bus protocol there are 7 data frames, and each data frame can contain 8 bits of data the wait_table can be declared as follows.
b) Instantiating the serial debuggerIn the second steps we need to do the installation of the serial_debugger interface inside your testbench topFigure 4. Declaration of the serial_debugger in testbenchc) Define the start signal.Define the signal start which can be use by serial_debugger from the time where to start analysing the incoming signals.
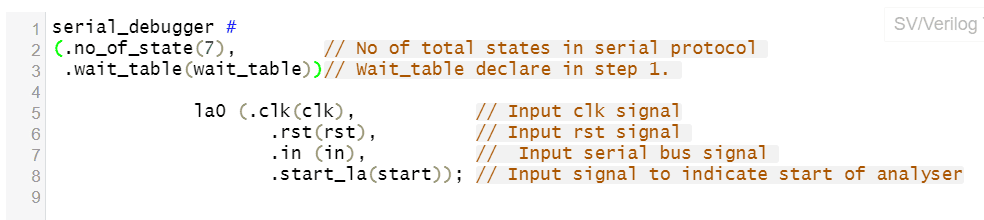
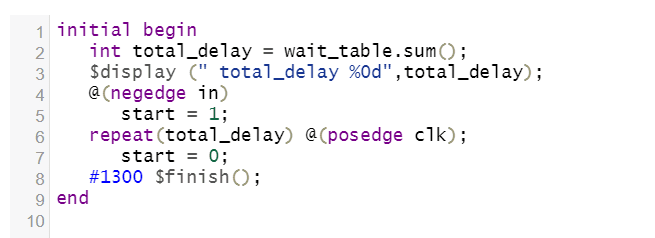
Figure 5. Declaration of the start_signal in testbench
VI. SAMPLE OUTPUT
The sample output waveform is shown in the below figures.Fig 6. Output of state 01 is value ‘h01 (‘h80)
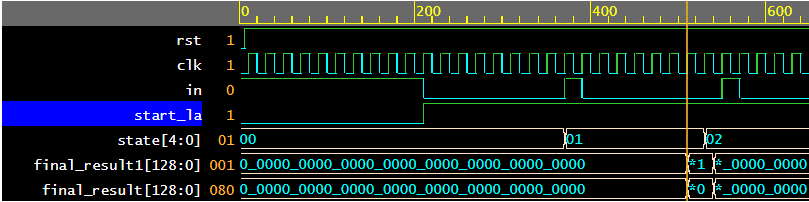
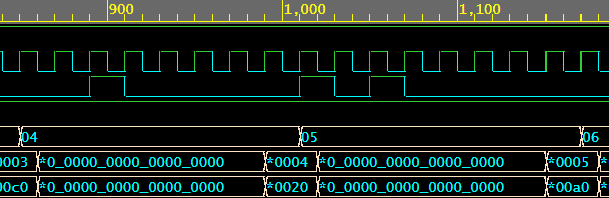
Fig 7. Output of state 04 is value ‘h04(‘h20) and output of state 05 is ‘h05 (‘ha0)
VII.FEATURE OF INTERFACE
• It can be used with any serial bus protocol.• It been developed inside interface which can be ported in design and testbench.• The frame format is customizable hence you can increase and decrease the size as needed.• The output is shown in big- and little-endian format.• It shows the bits captured against each frame.• The interface is synthesizable which can help in debugging the actual silicon bugs.